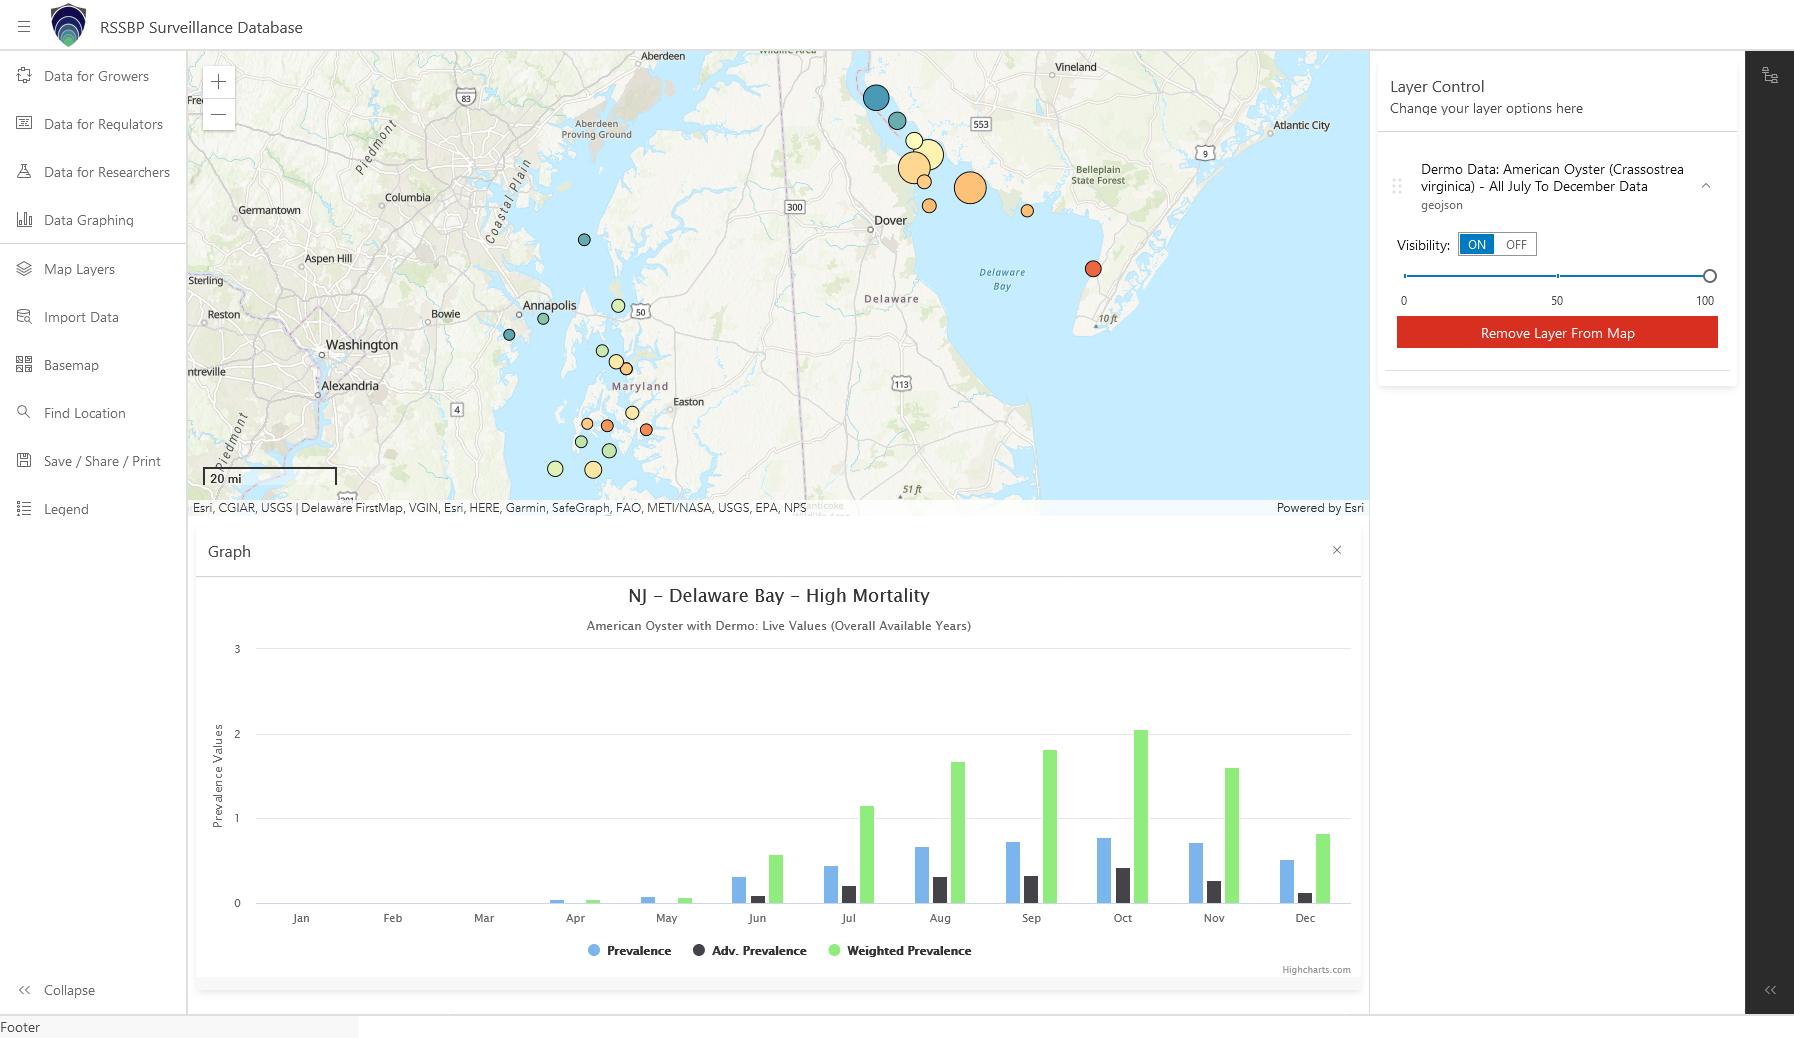
The purpose of this application tool is to provide information on the distribution and abundance of shellfish pathogens along the East Coast of the United State in a manner that allows informed decisions regarding the risks of spreading or exacerbating disease from shellfish transfers.
The interactive Mapper allows viewers to:
Compare pathogen occurrences between two locations
Look at pathogen histories in a particular area through time